Volatility Score & Volatility Premium:
With the goal of serving users with significant cryptocurrency holdings, it is vital to be able to monitor the very volatile cryptocurrency price behavior and maintain optimal risk. Subsequently, two components of the DACS were engineered to properly evaluate these crypto assets: the volatility score and asset quality score. With the detailed calculations of both scores shown below, the volatility score is made to appropriately evaluate a cryptocurrencies volatility relative to a crypto market index. The market index used is the Total Crypto Market Capitalization (ticker: TOTAL1 from coinmarketcap.com). The Total Crypto Market Capitalization is the total comprehensive market capitalization of the cryptocurrency market. Essentially, the volatility score measures the deviation of a portfolio/cryptocurrency's volatility against a market index while also acknowledging how correlated they are. It is important to note that the volatility score is designed to measure short-term volatility which means that the volatility score is calculated with data ranging from a maximum 1 year. At this time, it is still in discussion whether to use data ranging from present - 3 months / 6 months or 1 year
\[ \text{Volatility Score} = \left( \text{Relative Volatility} \cdot \left( 1 - |\beta| \right) \right) + \left( \text{Mean}(|a - m|) \right) \] \[ \text{Final Volatility Score} = \begin{cases} \text{Final Volatility Score} = 1 \text{ if } \text{Volatility Score } \leq 0.7 \\ \text{Final Volatility Score} = \text{Volatility Score} \text{ if } \text{ Volatility Score} \leq 1 \text{ and } \geq 0.7 \\ \text{Final Volatility Score} = \frac{1}{\text{Volatility Score}} \text{ Volatility Score} > 1 \\ \end{cases} \] Where: \[ \text{Relative Volatility} = \frac{\text{Normalized}(\sigma_a)}{\text{Normalized}(\sigma_m)} \] Normalized \( \sigma_a \) denotes the normalized standard deviation of the asset \( a \)’s daily closing prices over a specified period. Normalized \( \sigma_m \) denotes the normalized standard deviation of the selected market index closing market capitalization / price over the same time. \[ \beta = \frac{\text{Covariance}(R_a, R_m)}{\text{Variance}(R_m)} \] \( R_a \) is the returns of the asset over a specified period. \( R_m \) is the standard deviation of the returns of the market index over the same said period. \[ \text{Mean}(|a - m|) = \frac{1}{n} \sum \left| \text{Normalized}(a) - \text{Normalized}(m) \right| \]
The 3 cases for the final volatility score represent the 3 different values we can get
- The first case with volatility score < 0.7 is the best score which is achieved by holding a large amount in non-volatile coins
or stablecoins
- The second case with volatility score <= 1 and >= 0.7 is a good score which is achieved by holding a mix of non-volatile coins
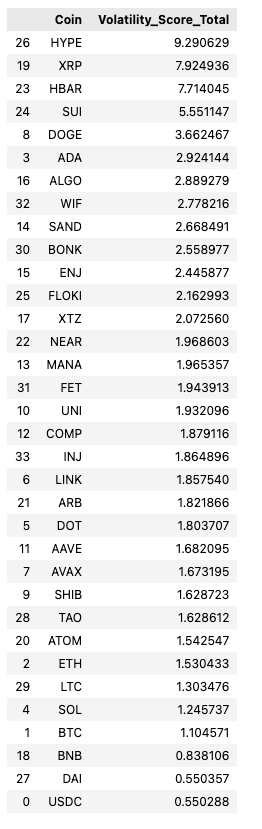
- The third case is the worst case where the volatility score is greater than 1 i.e XRP. It penalizes holding very volatile coins.
The Volatility Score can be calculated on both individual coins and portfolios. Below is a dataframe of several notable volatility scores of cryptocurrencies (updated as of September 3 2025) (The higher the volatility score, the worse it is). The volatility score is calculated as a portfolio in a whole where the parameters inputed into the equation are the portfolio numbers and not a weighted sum of the coins like how asset quality is calculated. An overall portfolio volatility score of less than 0.5 achieves a full score:
Voaltility Premium:
The max volatility premium is 1% on top of the interest rate with increments of 25 basis points. What we can do is go from 0 to 0.25 to 0.5 to 0.75 to 1% basis points where 0 is the best possible portfolio. Essentially, we can inherently use the volatility score portion of the DACS and treat it as a score where a volatility score of 100% will have 0% volatility premium, a volatility score of 75% - 100% will have a 0.25% premium, a volatility score of 50%-75% will have a 0.5% premium, a volatility score below 50% (really risky) will have a 1% volatility premium. This is a very simple approach to computing volatility premium but I believe that the volatility premium should have a close relationship to the volatility score.
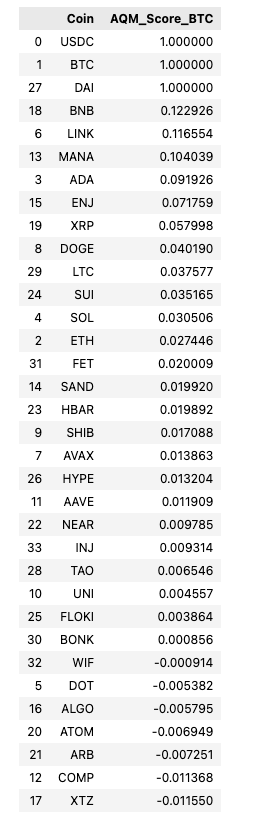
Asset Quality Score:
While the volatility score compares the short-term volatility of a cryptocurrency/portfolio against a market index,
the Asset Quality score is designed to measure the likelihood a cryptocurrency will retain its value in
the future based on its past returns and prices compared to a market index. Therefore, the Asset Quality score
uses price data ranging from the inception of the coin to the present. The market index used for
the Asset Quality is Bitcoin. Therefore, the asset quality asses consistency of returns, how correlated
a portfolio / cryptocurrency is to the market index and the plausibility of the returns. Plausibility of
returns evaluates whether the return of the asset is reasonable compared to the price behavior of
Bitcoin. If the asset evaluated aligns with the market sentiment trend wherein the market shows strong
upward /downward movement and the asset follows suit, then the asset quality will score higher
thereby evaluating a higher likelihood for continued and sustained returns. Likewise, this methodology
will penalize coins that have significantly positive movements but are not correlated to the market.
Unlike the volatility score, we are not gonna use the formula to calculate an overall score for a portfolio since by
the methodology, the asset quality score is designed to be calculated per coin not per portfolio. Therefore, the final asset
quality score is a weighted sum of the individual coin's asset quality scores with the weight being the percentage owned by the user.
Meme coins are going to be penalized by a factor of 1 / Volatility Score. The reason for this is because meme coins with a high marketcap
that are already established have outperformed Bitcoin and causes unexpected Asset Quality values (much higher because they outperform the market
overtime consistently).
The \[\frac{1}{e^{-\lambda t}}] portion of the equation is designed to penalize newer coins more than older coins. Newer cryptocurrencies carry a riskier risk
profile than older coins and it makes sense to penalize newer coins' asset quality.